Sunday 25 June 2017

Export Multiple OBIEE Reports into Single Excel File

Last week, my Boss came back with a new requirement of exporting multiple OBIEE reports to a single Excel file. Normally, we can achieve this by clicking on the Drop-down at the top right corner of the screen. Once you get the Drop-down, follow the path -> "Export to Excel" -> "Export Current Page".


But, this downloads the entire Page even with Prompt ('Execution Plan Name' in this case).


But, as per the requirement, only the Reports need to be extracted, and the individual "Extract" will not work in this case as we want to extract both the reports (or may be more) in the same Excel Sheet.

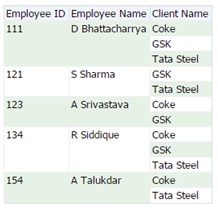
To achieve this, I have created one more page, let us call it 'DL', and same set of 2 reports (appended 'DL' in the name).

For the Header Report; which has 1 column less than the 2nd one, I have added 1 Dummy Column and kept the formula as ' ' i.e. (blank). And have also changed the background color of the column to white, so that when the Report is downloaded; the Dummy Column is not noticed.


I have removed the Title for the "Header" and "Detail". (However, it is entirely based on design requirements OR preference).


Now I have placed both the reports in the page "DL" and have made the hidden the page.


Now, my objective is to add a link in the 1st Page for downloading the entire 2nd Page i.e "DL" in this case. Scripting languages come handy in this sort of tasks, so here I have used JavaScript.

We have multiple options of exporting the file in a single Excel file like, exporting the file using either a Button or a Link. I will demonstrate both the options, but will be using only one option out of the two.

1. Button - 
You can use the below code to show a Button "Export Current Page" on the Dashboard.

<input id="idDashboardExportToExcelMenu" binit="true" role="menu" aria-activedescendant="popupMenuItem" aria-haspopup="true" style="width:175px;height:30px ; background-color: rgb(47, 95, 135); color: rgb(255, 255, 255); font-size:13px; font-family: Arial,sans-serif;  -moz-border-radius: 4px;

    -webkit-border-radius: 4px; cursor:pointer;border-radius: 4px; display:block; padding:4px;background-image:none; text-align:center;" onclick="return saw.dashboard.exportToExcel('/users/admin_user/_portal', 'DL', true);" role="menuitem" value="Export Current Page" type="button"/>


2. Link -
Use the below code to show a link "Export All" on the Dashboard.

<a name="ReportLinkMenu" title="Export to different format" href="javascript:void(null)" onclick="return saw.dashboard.exportToExcel('/users/admin_user/_portal', 'DL', true);">Export All</a> 


In this case, I will be using the 2nd option i.e. Exporting the file using a Link.


After running the report, when the user clicks on the "Export All" Link; he / she gets the desired Excel file as below:


Saturday 17 June 2017

Putting Multiple Rows into a Single Row

This is a requirement which I face quite often in my current project, with a FMCG MNC where the client asks us to converge multiple rows into a single one. This can be done using various tools, but I am using OBIEE to demonstrate the case.
For understanding, let’s take the example of 'Employees' with different 'Skills' working / have worked in multiple 'Projects' (couldn't think of any better example).

So I have got 5 tables with relationship as below:

Now, I get these tables in the BMM Layer i.e. Business Modeling and Mapping OR Logical Layer, and from there expose them to presentation.

When I select "Employee" Dimension Table and "Project" Dimension Table, it works fine i.e these Employees have worked in various Projects over the time as shown by the below screenshot:

Similarly, when "Employee" Dimension Table and "Skill" Dimension Table are selected that also works fine which means these Employees have different set of Skills as given below:

But when all the three Dimension Tables i.e. "Employee", "Project" and "Skill" are brought together, the relationship is displayed as below:


The problem with above diagram is that, it shows the Employee having all the Skills in all the Projects. As EMPLOYEE_D is the connection between ALLOCATION_F and SKILL_MATRIX_F, so the cardinality between ALLOCATION_F and SKILL_MATRIX_F is N : N and hence the data is displayed as shown in the above screenshot.

As "Skill" is associated with "Employees" only, and the Business Requirement is to put the Skills / Employee into a single cell. But when EMPLOYEE_D and SKILL_D tables are queried on EMPLOYEE_SID and SKILL_DESC, the result is somewhat as given below:

But, there is a function in Oracle i.e. ‘LISTAGG’, which can converts multiple rows into a single row. When the same columns are used in a query using the LISTAGG function, as shown below; the result of the query looks quite similar to the Business Requirement.

Now I will create an Opaque view in the RPD with the same SQL, let’s call it SKILL_VW.


Now I join the newly created view SKILL_VW with ALLOCATION_F Fact Table on EMPLOYEE_SID. See the screenshot below for reference:


The revised Physical Layer looks like:
And when I display EMPLOYEE, PROJECT and SKILL using the view SKILL_VW in the Presentation Layer, the result is:


If you are aware of any alternative approach for meeting this requirement, then please leave your approach as comments below.

Thursday 8 June 2017

Your Personal BI Assistant – Oracle Day by Day

I was attending Live OPN PartnerCast in May 2017, where I heard for the first time about "Oracle Day by Day" (pardon my ignorance) and I was totally fascinated at what I learnt.
It is the age of Siri, Cortana or Google Assistant and who does not like to have a personal assistant? Imagine you are a Mid or Senior Level Executive and you need to make strategic (long term) or operational (day to day) decisions. Would it not be great if you have a personal assistant who would help you with these Business Intelligence decisions?
         
Let's take the case of a Customer Support Manager in Europe (courtesy: Oracle Open World 2016), who is on the train to his work and gets a slack notification on his cell "Pre-Orders exceed forecast in Europe!".


On going to the slack channel he finds that Pre-Orders of VR1 Headset is exceeding the Forecast by 20%, and it also makes some recommendations on the analytics.


When the Manager clicks on the Report, it takes him to "Oracle Day by Day" i.e. Smart Feed Analytics, which pushes a list of cards with personalized analytics throughout the day. And the cool part is that he can actually verbally ask questions like "Show Pre-Orders versus forecast for VR headsets in Europe".


And it gets him the analysis, just like that.


He can add this to his calendar to give him a reminder on every Monday to look into the analysis.


Next, he shares the same analysis with his team so that they can discuss it on coming Monday.


He also travels to Italy often to meet his Sales team there. So he has said "Oracle Day by Day" to bring up certain analysis whenever he visits Italy.


Using the phones location the app provides the analysis.

Now coming to installing "Oracle Day by Day" on your phone::
Search for "Oracle Day by Day" on Google Play Store / Apple App Store and install it.


Once the App is installed and you open it for the 1st time, it will ask for an OBIEE URL. Give the URL along your credentials, and you are all set to go mobile with your personal BI Assistant.


Meet you next time, may be with some more fascinating Mobile BI insights.

Thanks  and happy reading. 

Tuesday 6 June 2017

My First Blog - Using Progress DataDirect Connectors

Hi Guys,

This is my first ever blog. I had a wish on writing something on BI for quite some time, but unable to think of a topic to start with. Then few days back my Boss asked me to try SFDC as a Data Source for the OBIEE environment. And while doing that the idea of this topic came. Frankly I have used DataDirect Connectors before also for connecting OBIEE in Unix with MS SQL Server DB in Windows. But back then I have not tried my hands on the Cloud. Hope it will be useful.

We sometimes come across requirements for connecting to various Data Sources like Hive, Greenplum, SFDC, Teradata etc using ODBC / JDBC. 
This can be quite easily achieved using 3rd Party Drivers from Progress, Simba, Easysoft, Rssbus etc.
In this case we are going ahead with Progress DataDirect (https://www.progress.com). It comes up with solution for connecting to multiple different Data Sources. As mentioned in the site.

For this discussion as source we are taking SFDC (www.salesforce.com). 
First we have to select the source (SFDC in this case), Interface and OS and download the driver.

Next step is to install and use it to create ODBC DSN.

This ODBC driver though downloaded for SFDC but it can be used for multiple other sources also.


To create a DSN select the desired driver and fill up the details. In our case the SFDC.

And Test.

Voila we good to use the DSN. We can use it in OBIEE 11g / 12c RPD or any other BI Tool also.
Next time we will try to explore other sources like Google Analytics or MS SQL Azure. 

Till then happy reading and happy blogging. Please give your comments.


Implementing & Testing Row Level Security in Power BI

I have suffered a great deal of pain while implementing and more so while validating Row Level Security in Power BI. Let me try to capture a...