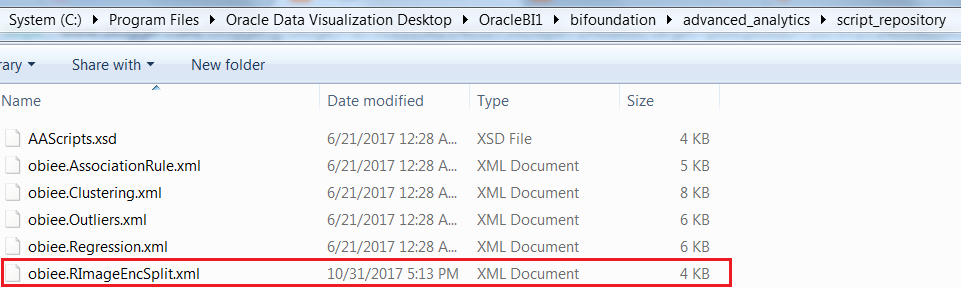
To begin with Oracle DVD is built with R and Java, and for the Analytics options like Clusters, Outliers etc we can find the corresponding codes in 'Oracle Data Visualization Desktop\OracleBI1\bifoundation\advanced_analytics\script_repository' folder.

For this demonstration, I am going to use Base64Image plugin that displays a base64 encoded image directly in Oracle DV.Image is assembled from chunks of encoded strings. It requires three inputs: image id, image parts sequence and image parts.
This plugin is available at Oracle Analytics Library along with lot of other plugins, may be we can try to explore them one by one later.

Once we have downloaded the plugin, we go to console and upload the custom plugin.

Once the plugin is successfully uploaded we can view it in the list of visualizations.

For the purpose of this demonstration, let us use Sample Order Lines data. Once we add the Base64ImgViz Plugin, we see it is asking for Image ID, Image Part ID and Image Part.

Now before we proceed any further we need add the custom R script in Script Repository. And for that I am going to use the xml below :
<script>
<scriptname>obiee.RImageEncSplit</scriptname> <version>12.2.1.0.0</version>
<inputs>
<column>
<name>Prod</name>
<nillable>NO</nillable>
<required>YES</required>
</column>
<column>
<name>Sales</name>
<nillable>NO</nillable>
<required>YES</required>
</column>
<column>
<name>Profit</name>
<nillable>NO</nillable>
<required>YES</required>
</column>
<column>
<name>Q_Ordered</name>
<nillable>NO</nillable>
<required>YES</required>
</column>
<column>
<name>Shipping_Cost</name>
<nillable>NO</nillable>
<required>YES</required>
</column>
</inputs>
<outputs>
<column>
<name>img_id</name>
<datatype>varchar(10)</datatype>
<aggr_rule>none</aggr_rule>
</column>
<column>
<name>img_part_id</name>
<datatype>varchar(10)</datatype>
<aggr_rule>none</aggr_rule>
</column>
<column>
<name>img_part</name>
<datatype>varchar(2000)</datatype>
<aggr_rule>none</aggr_rule>
</column>
<column>
<name>Metric</name>
<datatype>double</datatype>
<aggr_rule>sum</aggr_rule>
</column>
</outputs>
<options>
<option>
<name>dummmy</name>
<value>100</value>
</option>
</options>
<scriptcontent>
<![CDATA[
function(dat,dummy) {
library(base64enc)
#################### HeatMap Generation ######################
for (i in 2:ncol(dat))
dat[,c(i)] <- as.numeric(dat[,c(i)])
hm_dat <- as.data.frame(aggregate(dat[,c(2:4)],
by=list(Product_Sub_Category=dat[,c(1)]), FUN=sum))
df <- as.matrix(as.data.frame(lapply(hm_dat[,c(2:4)], as.numeric)))
metrics_matrix <- as.matrix(df)
row.names(metrics_matrix) <- hm_dat[,c(1)]
fpath = tempfile()
# setup tempfile to capture the heatmap image
png( fpath, width = 600, height = 600 )
hv <- heatmap(metrics_matrix, col = cm.colors(512), scale="column",
Rowv=NA, Colv=NA, margin=c(5,10),xlab = "",
ylab= "Product Sub Categories",main = "Metrics heatmap")
dev.off()
# Convert the image into a base64 encoded string
p <- base64encode(fpath)
# Break the image into substrings and number them
s <- substring(p, seq(1, nchar(p)-1, 2000), seq(2000, nchar(p)+2000, 2000))
# Capture all the fragments into a data frame
o <- data.frame(img_id=1,img_part_id = substring(1000+1:length(s),2,10), img_part = s)
o$Metric <- 1
return(o);
}
]]>
</scriptcontent>
</script>
This script is divided into :
- Input Columns
- Output Columns
- R Script
- Taking the data
- Set up the temporary file to capture the image
- Generate the image for heatmap
- Convert the image into base64 encoded string
In the script we are using library(base64enc), and to use that we need to install base64enc package.

Alternatively we can directly download the package from Cran Site, and unzip it and place it in the R Library.

And we can test it also.

Now let us go back to DVD and build 3 calculated columns to be used in Base64ImgViz Plugin
- Img_Id : EVALUATE_SCRIPT('filerepo://obiee.RImageEncSplit.xml','img_id', 'Prod=%1;Sales=%2;Profit=%3;Q_Ordered=%4;shipping_Cost=%5', XSA('weblogic'.'Sample Order Lines')."Columns"."Product Sub Category",XSA('weblogic'.'Sample Order Lines')."Columns"."Sales",XSA('weblogic'.'Sample Order Lines')."Columns"."Profit",XSA('weblogic'.'Sample Order Lines')."Columns"."Quantity Ordered",XSA('weblogic'.'Sample Order Lines')."Columns"."Shipping Cost")
- Img_Part_Id : EVALUATE_SCRIPT('filerepo://obiee.RImageEncSplit.xml','img_part_id', 'Prod=%1;Sales=%2;Profit=%3;Q_Ordered=%4;shipping_Cost=%5', XSA('weblogic'.'Sample Order Lines')."Columns"."Product Sub Category",XSA('weblogic'.'Sample Order Lines')."Columns"."Sales",XSA('weblogic'.'Sample Order Lines')."Columns"."Profit",XSA('weblogic'.'Sample Order Lines')."Columns"."Quantity Ordered",XSA('weblogic'.'Sample Order Lines')."Columns"."Shipping Cost")
- Img_Part : EVALUATE_SCRIPT('filerepo://obiee.RImageEncSplit.xml','img_part', 'Prod=%1;Sales=%2;Profit=%3;Q_Ordered=%4;shipping_Cost=%5', XSA('weblogic'.'Sample Order Lines')."Columns"."Product Sub Category",XSA('weblogic'.'Sample Order Lines')."Columns"."Sales",XSA('weblogic'.'Sample Order Lines')."Columns"."Profit",XSA('weblogic'.'Sample Order Lines')."Columns"."Quantity Ordered",XSA('weblogic'.'Sample Order Lines')."Columns"."Shipping Cost")
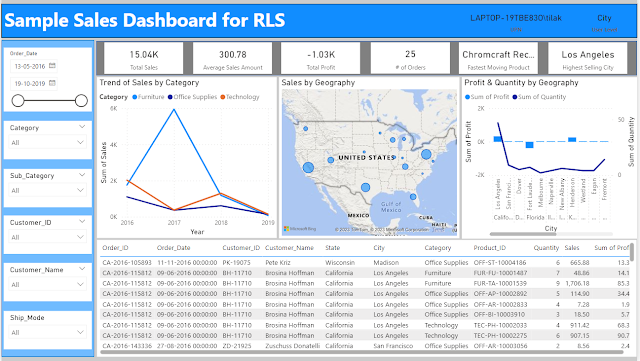
Once the calculated columns are done we can add them in the Base64ImgViz Plugin visualization and the result is like,

We can add filters also to further slice / dice the data.

And that's it. May be next we can try to explore some more R scripts or DVD plugins.