Tuesday, 29 August 2023

BI Self-Service & Power BI

With the evolution Data & Analytics consumption, our lives has become full of data. From ordering food πŸ”πŸ•πŸ° to checking the delivery status, from binge watchingπŸ“ΊπŸ‘€, to online shopping πŸ›’ we are always producing and consuming data. 

Long gone are the days of statis MIS reports and dependency on the IT teams for getting those reports. Even the prebuilt interactive reports are also not adequate and flexible enough for the data hungry workforces. Business users want empowerment πŸ’ͺ, to to create their own insights, or in other words self-service capability. 

Good for us that the current modern BI tools such as Power BI, Tableau, Qlik are quite capable to handle such self-service capability. But with freedom comes responsibility, so the challenges of self-service BI are as,

  • Standard - The organizational standards in terms of metrics definition, dimensional attributes, nomenclatures, UI etc. need to be consistent across.
  • Single source of truth - With everyone creating their own version of truth, it is very important to define the certified version.
  • Governance - To avoid lawlessness there has to be a strong governance structure and defined roles.
I will take the example of Power BI and try to explore how we can achieve self-service with overcoming the above challenges. 

There are 2 parts of the solution residing in Architecture and Access/Roles.

A. Architecture

To achieve this I would go with a layered architecture. Instead of keeping everything together in a single .PBIX or in a single workspace, let us split them to achieve greater flexibility. 


The left most layer in the dam represents the data layer and it is not part of the Power BI. Considering the data can be on-prem or cloud hosted and can be connected to Power BI directly or through Gateway. Again there can be different options of import vs direct query. In the case of later the the UI layer can be directly connected to the data.

Before going to the Power BI layers (from left to right), let us know that a .PBIX file has 3 major components, viz Data transformation (you can access by edit query), Data including model and tables, metrices, and reporting. These 3 components can be split into multiple workspaces spread across 3 layers. 
  1. Dataflow Workspace - This layer need to be created online in Power BI services only. This will contain the data source connectivity and the data transformations.
  2. Dataset Workspace - This will contain the imported data and the data model (relationship and cardinality). Basically these are .PBIX files developed offline but with blank pages.
  3. Reporting Workspace - This will contain the Reports only. These are .PBIX files, which will connect to the Power BI dataset instead of data source.
Now the question comes why do we have to take so much of pain, when we can easily perform everything in a single .PBIX file? πŸ˜•

Now the reason is flexibility to control and govern. From a PBIX file we can connect to single Dataset only, but a single Dataset can connect to multiple Dataflows. The plan is to create separate workspaces for secured and open Dataflows. basically the dimension data which should be available to all can be loaded through Dataflows residing in the open workspaces. Whereas the sensitive factual data can be loaded through different Dataflows residing in different workspaces, based on the departments. While creating a Dataset, these different Dataflows can be accessed based on the privilege and data can be combined. Furthermore based on the sensitivity of the data the Dataset can be put into secured or open workspace. So you can image while connecting from a UI file we get multiple combination of accessing the data, and that is going to play a key part in providing data access for Self-service. Moreover these Dataflows and Datasets can be certified to ensure the credibility.   

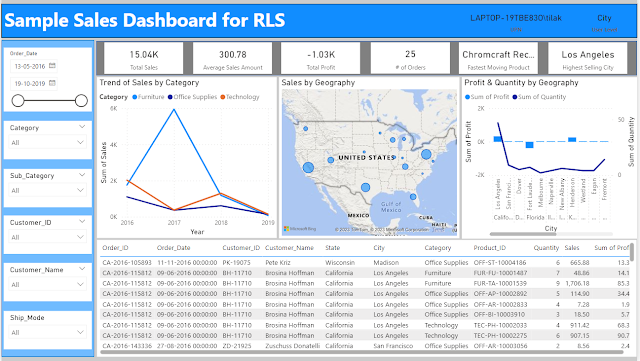
In addition to this we need to maintain the RLS (Row Level Security) πŸ” data to ensure data level security.

The PowerApps is like a cherry on the top πŸ’ here, it gives the end users to update the backend data by themselves. So our empowered end users are not only consuming the data, but they are producing also by themselves.

B. Access/Roles

Access / Role will play a major part in the governance, controlling who can access what and have gate keepers to ensure standards and consistency. There are 4 different roles in Power BI:


Let us try to understand and compare each role, what are the privileges they have or don't have.


Best practices for assigning roles:
  • The Admin user to be used for admin related activities only such as creation / deletion of workspaces, adding other admins etc.
  • The users who do not need to perform specific admin related activities, should not be with admin roles. 
  • Member roles can be leveraged for all other controls and deployments. They can even manage security for roles other than admin. 
  • The members should be responsible for all the content published to the larger audience. They should perform checks before final deployment.    
  • Contributors should not be allowed to update an app, that will do away with the benefit of having gate keeper and the standard of the content can be compromised.
  • The access should be given to user groups rather than individual users, that way controlling the access will be easier and there will be people to backfill others. 

Consumption 

Finally we are at the consumption layer. Here we will have 5 different user personas, starting from the top,
  • User 1 : BI Developer / Admin - Able to connect to the DB from Power BI desktop. RLS doesn’t apply. Practically they can do almost everything.
  • User 2 : Data Analyst - Able to connect to the dataflow and dataset from Power BI Desktop.
  • User 3 : BI Power User - Able to edit prebuilt published reports and create own’s. 
  • User 4 : BI Explorer - Able to personalize and share the prebuilt reports. The self-service is limited to to playing around with the prebuilt reports only.
  • User 5 : BI Consumer - Able to view, slice and dice the reports with no self-service capability. 


Saturday, 15 July 2023

Interesting Thoughts - Power of Shunya (Zero)

Our modern number system is heavily dependent on '0'. Thanks πŸ‘πŸ‘ to Mr. Aryabhata for capturing the concept of 'shunya' or void, and suggesting the base of decimal number system.

"From place to place, each is ten times the preceding" - Aryabhatiya by Aryabhata

Different ancient Indian mathematician such as Brahmagupta and Bhaskara have tried to decode the '0' afterwards. 


What happens when we introduce '0' in any calculation? 

For addition and subtraction it has no impact, or we can say absolutely zero impact πŸ˜‰


What happens in case of multiplication?

N x 0 = 0, basically repeating any number '0' times means nothing. 


The confusion starts with division. 

As per modern mathematics N/0 = Undefined. 

As per ancient Indian mathematician Bhaskara N/0 = ∞ (Infinite)


Let us try to do a simple calculation,

1/0.009 = 9000

1/0.0009=90000

1/0.00009 = 900000

And so on .....

So basically as the denominator is becoming smaller or getting closer to '0' the result is becoming bigger or getting closer to ∞ (Infinite).

Mathematically,     1/N   =   M

                               N→0      M→∞ 


Similarly, 

-1/0.009 = -9000

-1/0.0009=-90000

-1/0.00009 = -900000

And so on .....

So basically as the denominator is becoming smaller or getting closer to '0' the result is becoming bigger or getting closer to ∞ (Infinite).

Mathematically,     -1/N   =   -M

                               N→0      M→∞ 


Now, food for thought is N/0 = Undefined or Infinite 😯 ? And are there different infinites, like +∞ and  - ∞ ?


Reference: Numericon by Mariane Freiberger & Rachel Thomas

Saturday, 31 March 2018

Programming R within Tableau

In continuation of my earlier post on Integrating R with Tableau, now I need to explore how to program R within Tableau. 

R script needs to be used as a Table Calculation,  


and needs to be used as one of the 4 functions,
  1. SCRIPT_BOOL
  2. SCRIPT_INT
  3. SCRIPT_REAL
  4. SCRIPT_STR

Let me take a simple sample case to explain the same, I am using using_r_within_tableau.twbx downloaded from Tableau site for demonstration purpose.

Using the 0. 5 plus 7 as a data source. It has got 3 predefined measured, where 'Five' and 'Seven' holds value 5 and 7 respectively.


The 3rd measure 'R script for 5 + 7' adds up 'Five' and 'Seven' using R script. As I am adding 2 integers, I am using SCRIPT_INT. MIN aggregation is used on 'Five' and 'Seven' for Table Calculation, it could have been MAX or anything else also.


I initiate Rserve.

When I put these 3 measures, they add up and show correct result.


Further details and the sample Tableau file can be obtained from Tableau tutorial site.

Before I finish, I would like to draw a comparison between Power BI and Tableau with respect to using R. Power BI gives us the flexibility of using R charts (like ggplot etc) through R Visual, whereas in Tableau we get Integer / Real / Boolean / String values through Table Calculations.

In my personal opinion, I find Power BI more suitable for integrating with R.

Integrating R with Tableau

I have earlier used R with MS Power BI, and have decided to try out this R with Tableau. So as the first step I need to integrate it with Tableau.

As the first step I need to install Rserve : install.packages("Rserve")
Rserve is a package which enables applications like Tableau to use R without initializing each time, in other words, it is the connector between Tableau Desktop and R.

I am using RStudio for the ease of my purpose.


And then I run library(Rserve);Rserve() to start Rserve. My R environment is now ready to be used with Tableau.


I am using how_to_integrate_r_and_tableau.twbx downloaded from Tableau site for demonostration purpose.

When I open the 'Regression' worksheet, it shows me an error, it is unable to access the R service.


I am using my localhost as the R service, and I mention that in the External Service Connection.


The default port for R is 6311.


Now my R and Tableau should be integrated. And to test that if I open the 'Regression' worksheet, it works properly this time.


However the next worksheet 'Outlier' throws an error that 'there is no package called mvoutlier'. 


As R is package based, I need to install package mvoutlier.


And now the Outlier report starts working.


Further details and the sample Tableau file can be obtained from Tableau tutorial site.

Tuesday, 27 February 2018

Is it possible to show 2 lines in the same OBIEE graph, one for selected and other for all

A few days back one of my friends came up with a problem in OBIEE, is it possible to show a line graph having 2 lines in the same graph. One line representing Revenue by a selected Sales Person and another line as the average Revenue by the remaining Sales Persons.

This might be achieved through different ways, but what I preferred was to using a Presentation Variable.

1. I have created a union report, the 1st criteria contains, Month and Avg Revenue. 'All Sales Person' is a hardcoded dummy column.


Avg Revenue is coming directly from a fact, and it is a simple Average on Revenue.


2. The 2nd criteria contains Month and Avg Revenue with Filter in the formula.

I am using the formula = FILTER("Base Facts"."Avg Revenue" USING ("Sales Person"."E1  Sales Rep Name" IN ('@{var_SP}')))

Basically it will filter the Avg Revenue for a Sales Person, and the value of the Sales Person will be passed through the Presenation Variable var_SP.


And in the dummy column I put '@{var_SP}'. This will help me show the name of the selected Sales Person in the line graph.


3. Next I have created a Prompt to filter the Year and Sales Person (to pass the value for var_SP)


4. I have put them all together in the Dashboard. When I first run the report without any Sales Person selected, it shows me only the Avg Revenue for all Sales Persons.


But the moment I select a specific Sales Person, an additional line appears.


Now it is time to validate, if my report is giving right data or not. And for that purpose I have created 2 simple seperate reports with Month, Avg Revenue and Month, Sales Person (Aurelio Miranda only) and Avg Revenue.


The result is matching with the chart, and that validates the Line chart report.

Implementing & Testing Row Level Security in Power BI

I have suffered a great deal of pain while implementing and more so while validating Row Level Security in Power BI. Let me try to capture a...