Showing posts with label Report. Show all posts

Tuesday, 27 February 2018

Is it possible to show 2 lines in the same OBIEE graph, one for selected and other for all

A few days back one of my friends came up with a problem in OBIEE, is it possible to show a line graph having 2 lines in the same graph. One line representing Revenue by a selected Sales Person and another line as the average Revenue by the remaining Sales Persons.

This might be achieved through different ways, but what I preferred was to using a Presentation Variable.

1. I have created a union report, the 1st criteria contains, Month and Avg Revenue. 'All Sales Person' is a hardcoded dummy column.


Avg Revenue is coming directly from a fact, and it is a simple Average on Revenue.


2. The 2nd criteria contains Month and Avg Revenue with Filter in the formula.

I am using the formula = FILTER("Base Facts"."Avg Revenue" USING ("Sales Person"."E1  Sales Rep Name" IN ('@{var_SP}')))

Basically it will filter the Avg Revenue for a Sales Person, and the value of the Sales Person will be passed through the Presenation Variable var_SP.


And in the dummy column I put '@{var_SP}'. This will help me show the name of the selected Sales Person in the line graph.


3. Next I have created a Prompt to filter the Year and Sales Person (to pass the value for var_SP)


4. I have put them all together in the Dashboard. When I first run the report without any Sales Person selected, it shows me only the Avg Revenue for all Sales Persons.


But the moment I select a specific Sales Person, an additional line appears.


Now it is time to validate, if my report is giving right data or not. And for that purpose I have created 2 simple seperate reports with Month, Avg Revenue and Month, Sales Person (Aurelio Miranda only) and Avg Revenue.


The result is matching with the chart, and that validates the Line chart report.

Sunday, 17 September 2017

Putting Horizontal and Vertical Records together in an OBIEE Report

Few days back one of friends came up with a very special requirement. He had 2 tables let's call them SALES_BUDGET_F, which stores the month wise budgeted sales, where the months are as the columns.


and SALES_ACTUAL_F, which stores the moth wise actual sales data, and this table is like a normal fact.

These 2 facts have joined by conformed dimensions Customer and Product. For the ease of our purpose in this case I have single dimension and let me call it CUSTOMER_PRODUCT_D. However having a single or multiple dimension will not cause any difference.
The objective is to show both the data together so that we can compare the Budget vs Actual.

Now before we proceed, I would like to mention this can be achieved through multiple ways, one of them can be creating an Opaque View in the  RPD or Materialized View. However in this case I will try to achieve the same through OBIEE.

In the logical layer I create a single fact with 2 LTS one for each of the physical facts. And the conformed dimensions are also mapped.

In the Fact - Sales, Year is mapped from both the facts. Actual Sales is computed from SALES_ACTUAL_F.

Month wise Budgeted Sales columns are calculated from month wise columns from the SALES_BUDGET_F. Like Jan Budgeted Sales = SALES_BUDGET_F.JAN

Now I start creating the report. First just to test if my tables are working fine, I create a simple report with Month ID (hard coded as 1 for Jan. I will be using it later for sorting) and Jan Budgeted Sales.

And it is working as desired.


Next I add columns for Month Name and Actual Sales (hard coded as 0)


I repeat it 11 more times in form of union for 12 months. And 1 additional criteria for Actual Sales, with Budgeted Sales column hard coded as 0.


Now let's check the result.


We need to get rid of these duplicate rows, and for that I use a Pivot view, with aggregation added on the measures.


And the net output looks like,


I put it in a dashboard with Customer, Product and Year prompt.


Before I conclude I would like to mention again that, this might be achieved through other ways too.

Monday, 14 August 2017

Auto Refresh OBIEE Dashboard / Report

​Few days back one of my colleagues came up with a strange requirement. His client wants to display one OBIEE Dashboard in the giant screen and wants the reports to be automatically refreshed in the page.

We have 2 ways to achieve this.

1. Refresh the entire page
2. Refresh the individual report

Let's go a little deep into this. But before we begin, one important prerequisite of this is the tables behind the report must be Cache disabled.

1. Refresh the entire page

This one is actually pretty strait forward. What I need is the code below :

<META HTTP-EQUIV = "REFRESH" CONTENT = "60">
<CENTER><p><b>Auto Reload 60 seconds</b></p></CENTER>

I create a simple report, I can take any column from any subject area.


And I add a Static Text view and paste the above code.


The 2nd line is completely optional. If you do not want any text to be displayed, skip this line.


Let me save this report as 'Auto Load'. Next I go to the dashboard page which I want to refresh automatically. In this case I go to Sample Demo Dashboard.


And I place the 'Auto Load' in this page. If You want you can keep this section hidden too.


When I run the page I will see reports getting refreshed after every 60 seconds.


And if you check the session logs, you can get a confirmation for this also.
Next let's focus on doing it for individual reports. 

2. Refresh the individual report

For this one we need to add the script for the reports, which needs to be refreshed. 

First I create a report, which I want to be refreshed automatically.

I create a report with Tile view to show # of Employees

I go to the page, and add the report that needs to be refreshed automatically, and add 'Refresh' link for the report.

Next I view the source of this page and search for 'javascript:HereLink'. It will take me to the code for refresh link. 


In my case it is javascript:HereLink(&#39;d:dashboard~p:f0315tdu3cqtmc6d~r:538mu6nhk4hpmbj0&#39;,&#39;Refresh&#39;)

I need the highlighted portion of the code above to use in my script. I add the script below in a Narrative View in my report

<html>
<body>
<script>
var myVar=setInterval(function(){reportrefresh()},5000);
function reportrefresh()
{
setTimeout("javascript:HereLink('d:dashboard~p:f0315tdu3cqtmc6d~r:538mu6nhk4hpmbj0','Refresh');",1000);
}
</script>
</body>
</html>


I am using 2 functions here,
a. setInterval : calls a function after every t time interval. In this case it is 5000 or 5 secs
b. setTimeout : calls a function after t time. In this case it is 1000 or 1 sec

In the compound view we can see the report getting auto refreshed.

In the dashboard page, where I have this report, I select 'Compound Layout 1' to be displayed.


It is time to test if it is working properly or not. My report is showing # of Employees as 31.

Next I add 4 new rows in my Employee table in the DB.

And I find my report in the dashboard has got automatically refreshed and is showing # of Employees as 35.


And if you check the session logs, you can get a confirmation for this also.


Pretty cool huh ... 😎😎

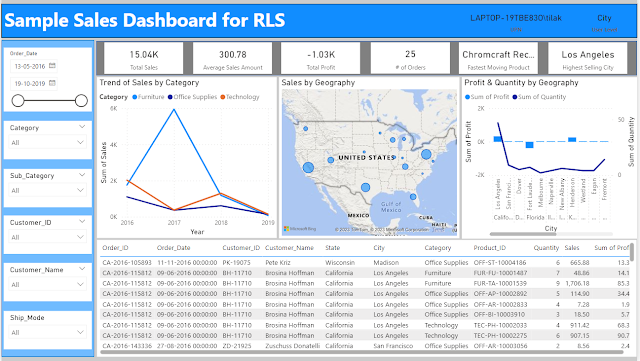
Implementing & Testing Row Level Security in Power BI

I have suffered a great deal of pain while implementing and more so while validating Row Level Security in Power BI. Let me try to capture a...