Showing posts with label Map. Show all posts

Thursday, 31 August 2017

Adding Maps 3: Integrating Google map with OBIEE through MapViewer

In continuation to my earlier blogs : Adding Maps 1: Integrating Google Geo chart with OBIEE , and Adding Maps 2: Integrating NAVTEQ / MVDEMO map with OBIEE in this blog I am going discuss on the steps to be done for integrating Google map with OBIEE using MapViewer.

Prerequisites: OBIEE is configure with MVDEMO or NAVTEQ data (refer to Adding Maps 2: Integrating NAVTEQ / MVDEMO map with OBIEE )

Step 1: First we have subscribe to Google Maps APIs
There are various options for subscribing to Google Maps APIs, which can be explored from:


Step 2: Create Tile Layer for Google Maps

• Click on ‘Create Tile Layer’
• It will bring up the window for filling up details to be provided for Google map. Most of the details are predefined.


• Only thing that needs to be provided is the Key. Which you will receive once you subscribe to Google Maps APIs

• Once done you can see the GOOGLE_MAP in the Tile Layer.


Step 3: Add Background Map in OBIEE Analytics

• In OBIEE Administration  Manage Map Data  Background Maps, add a new map for GOOGLE_MAP


• Once Background map is added, then edit is at add the Layers, and set the Zoom Level. 


• To use the Google map, select it from the drop down in Map view while creating an Analysis.


Step 4: For OBIEE 12c – Bug 23516700 – Google Map Fails Due To Content Security Policy Violation Error

a. Symptom
• On attempting to view Google maps, it shows blank page.  (refer Oracle Doc ID 2148973.1)
• The layers with background maps cannot be merged for a customized map
• The status of the below HTTP request fails with reply status as (blocked:csp) -https://maps.google.com/maps/api/js?sensor=false&callback=OM.finishLoadGoogleV3&key=AIzaSyDS1mbolVU2pHVpuEAcolDX-gQMXO0OI_w&_=1464850736427

b. Solution
• Take a backup of Middleware
• Add the below tags in the instanceconfig.xml:

<Security>
<ContentSecurityPolicy>
<Enable>false</Enable>
</ContentSecurityPolicy>
</Security>

• Restart all the services.

Step 5: Verify the Google Map, it should be working now.


From using map in MapViewer point of view it is same as MVDEMO / NAVTEQ and the best part is that the developer will have the privilege to use either of these.

Saturday, 26 August 2017

Adding Maps 2: Integrating NAVTEQ / MVDEMO map with OBIEE

In continuation to my earlier blog : Adding Maps 1: Integrating Google Geo chart with OBIEE , in this blog I am going discuss on the steps to be done for integrating NAVTEQ and MVDEMO map with OBIEE using MapViewer.

First we have downloaded the  ‘SampleApp’ file for NAVTEQ into our Oracle Database.
Oracle provides pre-configured maps, coordinates, and navteq data that we can use in our reports. We need to download the SampleApp / NAVTEQ Data Set.  Download link is given below :

http://www.oracle.com/technetwork/middleware/bi-foundation/obieesamplesarchive-2026956.html
http://www.oracle.com/technetwork/indexes/samplecode/bi-sample-522115.html

Next I have created NAVTEQ schema in our Oracle database (using SYS user).

grant connect, resource, create view to NAVTEQ identified by BISAMPLE;

From command line, run the following import command:

<Oracle DB Home>\server\bin> imp obiee_navteq/obiee_navteq@XE file=obiee_navteq.dmp FULL=Y


After the import is complete, I log into user NAVTEQ, then run these SQL statements:

INSERT INTO user_sdo_maps SELECT * FROM my_maps; 
INSERT INTO user_sdo_themes SELECT * FROM my_themes; 
INSERT INTO user_sdo_styles SELECT * FROM my_styles; 
INSERT INTO user_sdo_cached_maps SELECT * FROM my_tile_cache; 
COMMIT;

This is actually one of the most important steps, as without this the Map Tiles will not appear.

Once done, I open MapViewer by going to the following URL: http://machine.domain:port/mapviewer  (you can get this URL by replacing analytics with mapviewer in your OBIEE URL)

  • Click on the Admin link.
  • Log in to MapViewer using the same administrative user that you use to log in to the WebLogic console and FMW EM console.
  • Click on Configuration. This will open the mapViewerConfig.xml configuration file.

I made the following changes in the xml file:

1. Under <security_config> tag set the following values:

                       <disable_direct_info_request> true </disable_direct_info_request>
                       <disable_info_request> true </disable_info_request>
                       <disable_csf>true</disable_csf>
                       <enforce_security_role> true </enforce_security_role>  

2. Under <proxy_enabled_hosts> tag set the machine name (replace machine.domain by the proper host name where the MapViewer instance is running.)

http://machine.domain:port/mapviewer,http://machine.domain:port/

3. In <Mapperconfig> add DB connection information for NAVTEQ

  <map_data_source name="OBIEE_NAVTEQ_Sample"
                   jdbc_host="db1.sample.com"
                   jdbc_sid="orcl"
                   jdbc_port="1521"
                   jdbc_user="myuser"
                   jdbc_password="!mypassword" 
                   jdbc_mode="thin"
                   number_of_mappers="3"
                   allow_jdbc_theme_based_foi="false"
                   editable="false"
   /> 

Password should start with ‘!’ mark because that tells MapViewer that the password should be encrypted next time the MapViewer instance is restarted. Also, the data source might be lost on restart if the exclamation mark is no included.

For OBIEE 12c

4. In <mds_config> add entry of data source

<mds_config>
…….
<data_source name="[your source]">
<allow_predefined_themes>true</allow_predefined_themes>
<allow_dynamic_themes>true</allow_dynamic_themes>
</data_source>
…….
</mds_config>

Click on "Save and Restart" button to restart the MapViewer application for the changes to take effect.

It brings up the Tiles below:


Next I log in to Analytics and navigate to : Administration >Map Data Management >Manage Map Data >Layers tab >click on Import Layers button(right side) >select my Data Source under "Look in" 


From the list of themes I select any Theme. Then click OK.

Next I edit the layers and map the column in the layer to match the sample data.


Then I go to the Background Maps tab >click on Import Background Maps >select my Data Source under "Look in" >from the list of Tile Layers select the appropriate one.


I edit the background map and add the BI layer. If you want to change the zoom levels at which OBIEE data will be shown do so by clicking on the Zoom levels.


And NAVTEQ data is configured with OBIEE MapViewer. Now we can create an Analysis in OBIEE with a Map View.


In case of using MVDEMO the steps are same, only difference is that we use MVDEMO Schema instead of NAVTEQ schema.

You can download it from :
http://download.oracle.com/otn/other/mapviewer/mvdemo.zip
http://www.oracle.com/technetwork/middleware/mapviewer/downloads/index-100641.html

And the rest of the steps are same.

Sunday, 20 August 2017

Adding Maps 1: Integrating Google Geo chart with OBIEE

It is always very fascinating to display your data in Maps, and let me take the opportunity to decipher the integration of maps in OBIEE. As part of this series I will discuss on :

1. Integrating Google Geo chart (not map)
2. Integrating NAVTEQ / MVDEMO map with OBIEE
3. Integrating Google map with OBIEE through Mapviewer

For these configuration is similar in OBIEE 11g and 12c and I will demonstrate using OBIEE 11g, however I will mention wherever and change is required for 12c.

To start with let's first discuss, what is Google Chart ?

These charts are from Google, based on pure HTML5/SVG technology (adopting VML for old IE versions), so no plugins are required. All of them are interactive, and many are pannable and zoomable.

There are many different types of Google charts available, and these become very handy if you want to certain visualizations which are not available in OBIEE.

Go to https://developers.google.com/chart/interactive/docs/gallery to access these charts.


In this case I use Geo Chart.

There can be different options for look and feel, each one of them comes up with a HTML code. If we just copy and paste the code in a text file and save as HTML file it will show the same map with the same interaction.

For the purpose of this post I have considered the first one.

We can further notice that each one these codes has a piece for data, and the data is hard coded. Our objective is to pass data from OBIEE, rather than hard coding it.

To add a Geo chart in an OBIEE report, first I create a report using Country and Popularity.

Next I add a Narrative view and added  the following code, the columns need to be changed as per criteria.

a. In the Prefix Section :

<html>
  <head>
<script type="text/javascript" src="https://www.gstatic.com/charts/loader.js"></script>
    <script type="text/javascript">
      google.charts.load('upcoming', {'packages':['geochart']});
      google.charts.setOnLoadCallback(drawRegionsMap);
      function drawRegionsMap() {
        var data = google.visualization.arrayToDataTable([
          ['Country', 'Popularity'],

Notice I have changed the column names, this is showing the data labels in map. 

b. In Narrative Section :

['@1',@2] 

This should be preferably in this order only. And @1 should be in '' as it is of type character.

c. In Postfix Section : 

]);
        var options = {
                                backgroundColor: '#81d4fa',
                                colorAxis: {colors: ['#00853f', 'black', '#e31b23']},
                                };
        var chart = new google.visualization.GeoChart(document.getElementById('regions_div'));
        chart.draw(data, options);
      }
    </script>
  </head>
  <body>
    <div id="regions_div" style="width: 900px; height: 500px;"></div>
  </body>
</html>

And I check 'Contains HTML Markup' checkbox.


Final Output will be look like this with Country name and Popularity.


And we have our map .... 😉😉

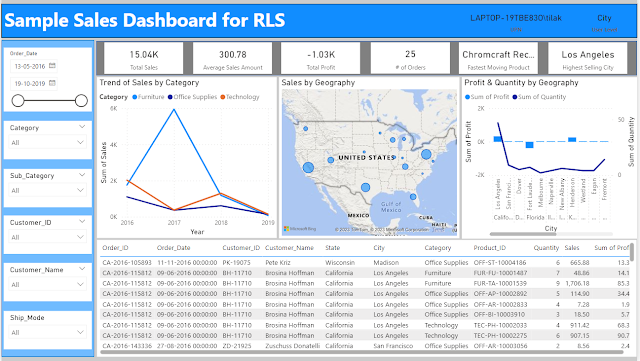
Implementing & Testing Row Level Security in Power BI

I have suffered a great deal of pain while implementing and more so while validating Row Level Security in Power BI. Let me try to capture a...