Tuesday, 27 February 2018

Is it possible to show 2 lines in the same OBIEE graph, one for selected and other for all

A few days back one of my friends came up with a problem in OBIEE, is it possible to show a line graph having 2 lines in the same graph. One line representing Revenue by a selected Sales Person and another line as the average Revenue by the remaining Sales Persons.

This might be achieved through different ways, but what I preferred was to using a Presentation Variable.

1. I have created a union report, the 1st criteria contains, Month and Avg Revenue. 'All Sales Person' is a hardcoded dummy column.


Avg Revenue is coming directly from a fact, and it is a simple Average on Revenue.


2. The 2nd criteria contains Month and Avg Revenue with Filter in the formula.

I am using the formula = FILTER("Base Facts"."Avg Revenue" USING ("Sales Person"."E1  Sales Rep Name" IN ('@{var_SP}')))

Basically it will filter the Avg Revenue for a Sales Person, and the value of the Sales Person will be passed through the Presenation Variable var_SP.


And in the dummy column I put '@{var_SP}'. This will help me show the name of the selected Sales Person in the line graph.


3. Next I have created a Prompt to filter the Year and Sales Person (to pass the value for var_SP)


4. I have put them all together in the Dashboard. When I first run the report without any Sales Person selected, it shows me only the Avg Revenue for all Sales Persons.


But the moment I select a specific Sales Person, an additional line appears.


Now it is time to validate, if my report is giving right data or not. And for that purpose I have created 2 simple seperate reports with Month, Avg Revenue and Month, Sales Person (Aurelio Miranda only) and Avg Revenue.


The result is matching with the chart, and that validates the Line chart report.

Integrating R with Power BI

I am fairly new to both Power BI and R. I know Power BI can be easily integrated with R, and there is Visualization available for that also. Therefore it would be great if can use both R and Power BI together.

First, I have checked that if my R script options are proper or not. Here I have set my R home directory and R IDE. With respect to R IDE (Integrated Development Environment), I will be explaining later.


Just to confirm I have 2 R directories and in this case I am going to use the 3.4.2, and the path correctly set in Power BI.

Next I add the R visual in Power BI.


It might ask you to enable it.


Now once it is added, there will be a R script editor available at the bottom.


For the purpose of the demo, I am using one csv file, I have received from a R training from Udemy (to confirm this is purely for demo purpose).

This csv contains 3 columns: carat (Diamond Carat), clarity (Diamond Clarity) and price (Diamond Price). Our objective is to prepare a visualization, to depict if the price is always proportional with the Carat and Clarity.


I add these 3 columns in the values for the R visualization, and you can notice a Dataset cotaining the columns gets created automatically.


Next for the purpose of my visualization I un-summarize carat and price. These are numeric field, and Power BI adds the aggregation by default.


Now before I start writing the code in the editor, let me go back to R IDE. There is a option on the top right of the editor, to open it is R IDE. What it will do is open the R Studio (as that is set as the R IDE for me), and I can do the coding in R Studio.


Going back to the objective creating a visualization to depict if the price is always proportional with the Carat and Clarity.

I have this piece of code in R Studio, which use ggplot, to create this chart.


Now I just copy and paste this code in the R Script Editor in Power BI. I just do minor change in the dataset portion.


When I run the code I get the same chart. And the best part is now I can use the additional Power BI capabilities like Slider etc with this.

Using D3.js

A few days back, for the first time, I heard about D3.js, and was really impressed with types and options of data visualizations it provides.

To start with what is D3.js?
D3 stands for Data-Driven Documents. It is JavaScript library for manipulating documents based on data. It lets you build the data visualization framework that you want, and bring data to life using HTML, SVG and CSS.

Who has developed it?
Mike Bostock wrote D3.js based on his work during his PhD studies at the Stanford Visualization Group.

Where to find D3.js library and sample codes?
D3.js library and sample codes can be found at https://d3js.org 


How D3.js works?
D3.js helps you attach your data to DOM (Document Object Model) elements. Then you can use CSS3, HTML, and/or SVG showcase this data. Finally, you can make the data interactive through the use of D3.js data-driven transformations and transitions.
When to use D3.js?
You should use D3.js because it lets you build the data visualization framework that you want. Graphic / Data Visualization frameworks make a lot of decisions to make the framework easy to use. D3.js focuses on binding data to DOM elements.
D3.js is written in JavaScript and uses a functional style which means you can reuse code and add specific functions to your heart's content. Which means it is as powerful as you want to make it. How you chose to style, manipulate, and make interactive the data is up to you.
You should use D3.js when your webpage is interacting with data, as it is a javascript library added to the front-end of your web application. Your back-end (the server) will generate the necessary data. The part of the application the users interact with (the front-end) will use D3.js.

Few samples,


Accessing Oracle Database Cloud Service using Putty


Wednesday, 31 January 2018

Using Custom Visuals in Power BI

Microsoft Power BI comes up with the option of using various Custom Visuals available in Microsoft Appsource. This feature gives endless options for Data Visualizations.

To start with let me built a simple Clustered Bar Chart, with Total Sales by Ship Mode and Product Category.


My objective is to build the same report using a Custom Visual, with a better way of representing the data.

First I have gone to the Microsoft Appsource and have selected the Infographic Designer, which will appropriate in this case. However, you can explore other Custom Visuals also.

Once I click 'Get Now', it takes me to the next page, here I can download the Custom Visual plugin or the sample report containing the plugin.

The plugin gets downloaded in .pbivz format.


Now I import the custom visual in the Power BI Desktop.


It shows a message that the import was successful.

And Infographic Designer is now available in the Visualizations pane.


Let me select that and use Total Sales, Ship Mode and Product Category. By default it will create a normal Bar chart.


I go the Format and change the Chart Type to Bar, which will convert it to a horizontal bar.


Next, to edit the custom visual, I click the pencil shaped 'Edit mark'.

This opens a Mark Designer window in the right. From here I can select different type of custom shapes for the chart.

I select file shape and enable the multiple units, this add multiple shapes in a single bar.


However, I have 3 Product Categories, viz Furniture, Office Supplies, Technology. It would be great if I can have different shapes for each of the categories. To achive that I have to enable the Data-Binding.


In the Data-Binding, I select Product Category.


And assign different shapes for each of the categories.


The final chart looks like,


Enabling Log in Oracle BI Publisher

Unlike OBIEE, there is no straightforward way in Oracle BI Publisher to view the log and the SQL generated for a report. However, there is a workaround to achieve the same, and in this post, I am going demonstrate that.

1. Open a text file and paste the code as below


LogLevel=STATEMENT
LogDir=D:\Tilak_Work\OBI11G\BIP_Debug

I have set the LogDir path according to my system, this needs to customized based on the environment.

For information, there are 7 levels of log information in BIP.
  • UNEXPECTED
  • ERROR
  • EXCEPTION
  • EVENT
  • PROCEDURE
  • STATEMENT
  • OFF


2. Save this file as xdodebug.cfg and place at <OBIEE Home>\Oracle_BI1\jdk\jre\lib


3. Restart the services. and now when I run some BIP reports and go to the log directory ('D:\Tilak_Work\OBI11G\BIP_Debug' in my case), I see multiple log files are generated. 


4. Among these files, if I check xdo.log file I can find the backend SQL for the BIP reports.


Configuring Oracle Database Cloud Service and Accessing using SQL Developer

I have used Oracle DBCS (Database Cloud Service) as part of BICS (Business Intelligence Cloud Service) before, which comes as preconfigured. But to use DBCS as part of Oracle Analytics Cloud, we need to configure it first. Now I have got my trial OAC account, so I have 3 objectives, 
  1. Create and configuring Oracle Database Cloud Service instance
  2. Access the DBCS using SQL Developer in my local
  3. Accessing the DBCS EM online

First I have to create a DBCS instance, and to do that I go to Oracle Cloud My Services - Dashboard, and click on 'Create Instance'.


And click on the Database option in the popup.


Next I have to select the preferances / configurations I want for my DBCS. I am taking Oracle DB 12c Release 1 - Enterprise Endition, which is compatible with Analytics service also.


In the Details page I set the DB name and the Administrator / SYS password. I have not chosen any Backup and Recovery option, as it would mean additional cost, and I don't need it for this demo purpose. 

There is an option for SSH Public Key. You can edit it. I would prefer to create fresh Public - Private Key pair using Putty Key Generator. This would be beneficial for connecting to Oracle DBCS from Putty.  


Once done I confirm and create my DBCS instance.


It will take some time for Oracle to create and configure the DBCS instance, and the status will show 'Creating service ..', and if I hover my mouse on that it shows me the details.

Once the status is completed, I have achived my 1st objective. But now what about 2nd and 3rd. The problem is now if I try connect to the DBCS from my local SQL Developer using the informations such as Public IP, Port etc, it is not connecting and I am unable to open the DBCS EM in the browser.

Actually I have spent quite some amount of time on this bottleneck, and what I have learnt is,
there are 2 major ways to connect to the DBCS using SQL Developer, viz

  1. Using SSH when the Listener Port is Blocked
  2. Without using SSH when the Listener Port is Unblocked

For now I am focusing only on #2. I will try to cover #1 alongwith connecting from Putty in a later post.

Now I need to use the Oracle Database Cloud Service console to enable one of the automatically created access rules.

I click the Navigation menu icon navigation menu in the top corner of the My Services Dashboard and then click Database. The Oracle Database Cloud Service console opens.

From the hamburger menu icon menu for the database deployment, select Access Rules and the Access Rules page is displayed. It contains the following access rules set to a disabled status.
  • ora_p2_dbconsole, which controls access to port 1158, the port used by Enterprise Manager 11g Database Control.
  • ora_p2_dbexpress, which controls access to port 5500, the port used by Enterprise Manager Database Express 12c.
  • ora_p2_dblistener, which controls access to the port used by SQL*Net.
  • ora_p2_http, which controls access to port 80, the port used for HTTP connections.
  • ora_p2_httpssl, which controls access to port 443, the port used for HTTPS connections, including Oracle REST Data Services, Oracle Application Express, and Oracle DBaaS Monitor.
I enable ora_p2_dbconsole and ora_p2_dblistener, which are required for the EM and the SQL Developer respectively.


And now I can use the same details as below to connect to DBCS using SQL Developer in my local.


And similarly I am able to open the EM also using internet browser.


Which confirms the closure of my 2nd and 3rd objectives.

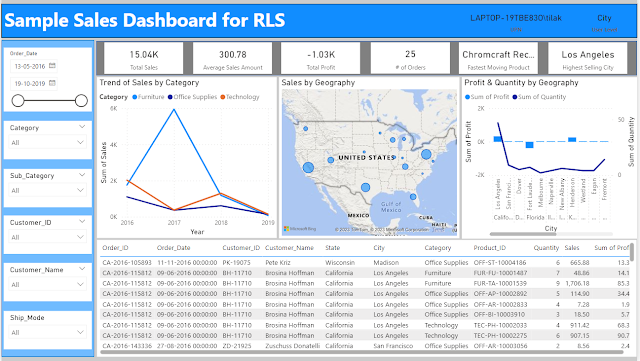
Implementing & Testing Row Level Security in Power BI

I have suffered a great deal of pain while implementing and more so while validating Row Level Security in Power BI. Let me try to capture a...